View images in OMERO.imageviewer
OMERO.imageviewer is a basic 2D viewer which can open and browse multi-t, multi-z and multi-channel images and allows to show Regions of Interest (ROIs) and adjust rendering details including displaying histogram.
Description
We will show here:
How to open multidimensional images in OMERO.imageviewer
How to change rendering settings in OMERO.imageviewer and scroll through z and t
How to use the Histogram feature
How to zoom the image and see the scale bar
How to see a maximum intensity Projection
Resources
Example image used can be found under Project omero-training in Group Training_Jan_2025
Note: Only some of the images in this dataset are z-stacks, for example
Dataset siRNAi-HeLa, image IN_03.r3d_D3D.dv
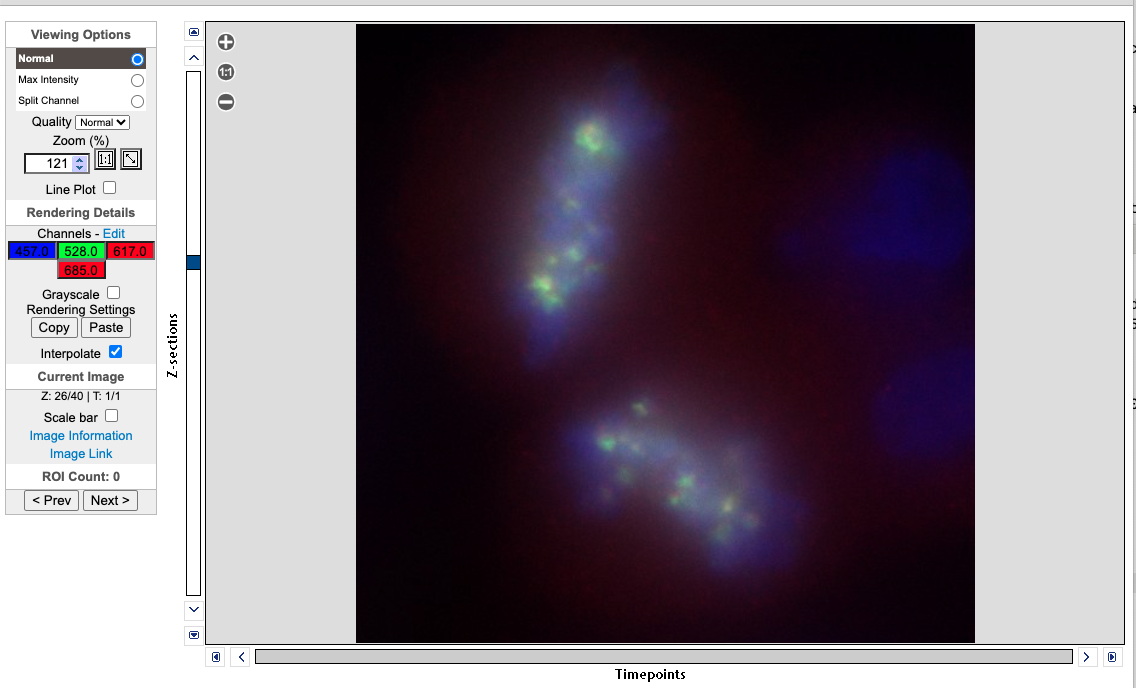
Double-click on an Image thumbnail, or click the icon next to the
Full Viewer button in the right-hand pane to open an Image in a larger viewer called OMERO.imageviewer.
It is a Web app developed and released independently from the webclient. The OMERO.web framework can be extended with multiple apps to view data in different ways.
button in the right-hand pane to open an Image in a larger viewer called OMERO.imageviewer.
It is a Web app developed and released independently from the webclient. The OMERO.web framework can be extended with multiple apps to view data in different ways.Zoom in and out of the image by using the
+and-buttons in top-left corner or by scrolling the mousewheel.We can adjust the rendering settings and scroll through Z or T.
On the left panel, you can also show the intensity of the channel as
Grayscaleby checking the checkbox.Still staying in the left panel, click on the
Editlink next to theChannelsword near the middle. A rendering panel will appear.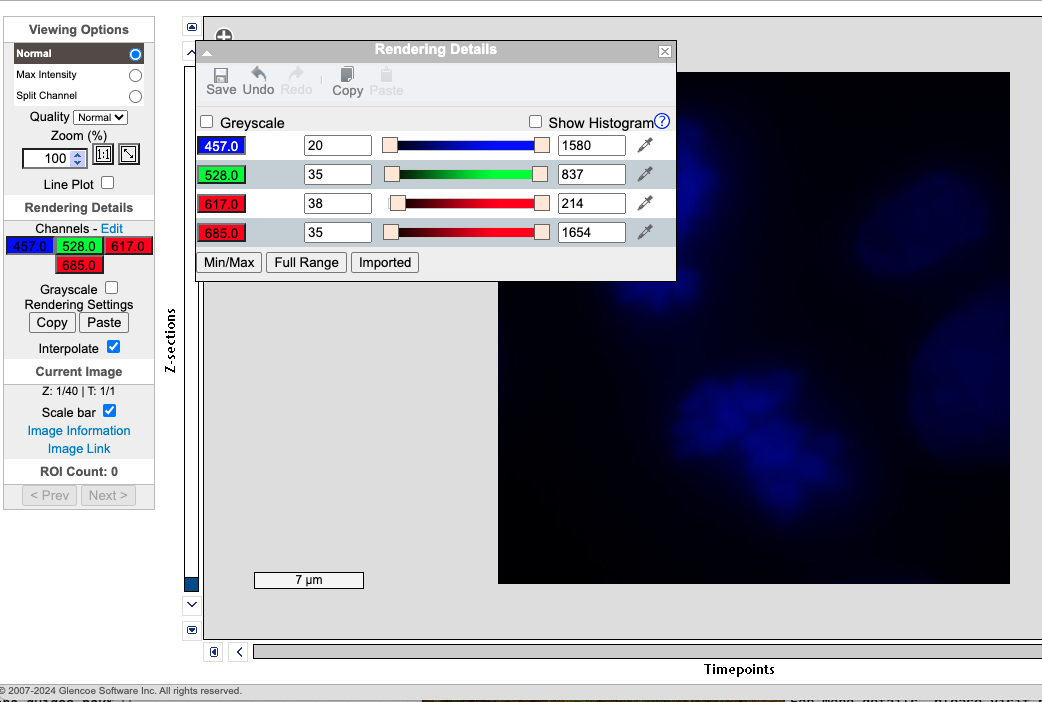
Click on the
histogramcheckbox on the floatingRendering Detailspanel. A histogram of the first channel will appear. Note that when you move the rendering settings sliders beneath the histogram, the histogram updates to showing the channel you just manipulated.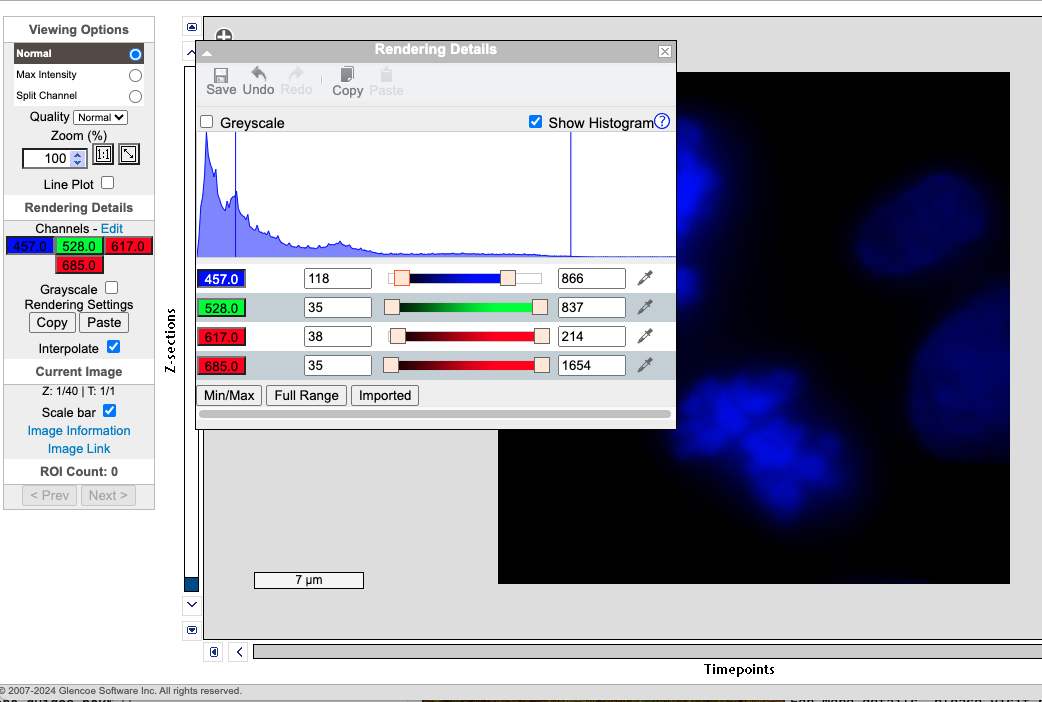
Click on the
Copyon the right hand panel underRendering Detailson on top of the floating window, you can save the settings of your rendering settings and you can open another image and click onPasteto set the image with the same rendering setting. You can also save the settings by clicking on theSaveto save the setting.You can switch on or **off* on each of the channels on the
Click on the
Max Intensityon the top right panel to get the Maximum Intensity Projection of a z-stack.Click on
Image Informationon the righthand panel, a floating window ofImage Informationwill appear.