Symptoms_diary
symptoms_diary.Rmd
library(chronogram)
library(dplyr)
#>
#> Attaching package: 'dplyr'
#> The following objects are masked from 'package:stats':
#>
#>     filter, lag
#> The following objects are masked from 'package:base':
#>
#>     intersect, setdiff, setequal, union
library(ggplot2)
We re-use the smallstudy dataset with two
modifications:
addition of participant #4, who has only dose 1
addition of symptoms diary information, including that participant #4 had a serious reaction to vaccination and therefore opted not to have further vaccinations.
This is a plausible, but fictitious dataset.
data(smallstudy)
metadata <- smallstudy$small_study_metadata
ab <- smallstudy$small_study_Ab


## Add a 4th participant's metadata ##
## [in real use, a bigger metadata tibble should be made, not two tibbles combined via bind_rows()]
metadata  <- bind_rows(
  metadata,
  tibble::tribble(
      ~elig_study_id,   ~age, ~sex,   ~dose_1,   ~date_dose_1, ~dose_2,   ~date_dose_2,
      4,             25,    "M",   "AZD1222", lubridate::dmy('07012021'), NA, NA
)
)

metadata <- metadata %>%
  mutate(sex = factor(sex)) %>%
  mutate(dose_1 = factor(dose_1))

metadata
#> # A tibble: 4 × 7
#>   elig_study_id   age sex   dose_1   date_dose_1 dose_2   date_dose_2
#>           <dbl> <dbl> <fct> <fct>    <date>      <fct>    <date>
#> 1             1    40 F     AZD1222  2021-01-05  AZD1222  2021-02-05
#> 2             2    45 F     BNT162b2 2021-01-05  BNT162b2 2021-02-05
#> 3             3    35 M     BNT162b2 2021-01-10  BNT162b2 2021-03-10
#> 4             4    25 M     AZD1222  2021-01-07  NA       NA

##--------------------------------------------------------------------
## Add symptoms diary info

symptoms_to_add <- tibble::tribble(
  ~elig_study_id, ~calendar_date, ~symptom_fever, ~symptom_headache, ~symptom_joint_pain, ~symptom_rash,
  1,              "06012021",     "mild",          "moderate",           NA,                  NA,
  1,              "07012021",     "mild",              NA ,              NA,                  NA,
  1,              "08012021",       NA,                NA ,            "severe",              NA,
  4,              "10012021",       NA,                 NA,               NA,          "required_hospitalisation")

symptoms_to_add <- symptoms_to_add %>%
  mutate(calendar_date = lubridate::dmy(calendar_date))
Assemble this new chronogram
start <- "01012020"
end <- "10102021"

cg <- cg_assemble(
 start_date = start,
 end_date = end,
 calendar_date_col = calendar_date,
 metadata = metadata,
 metadata_ids_col = elig_study_id,
 experiment_data_list = list(ab, symptoms_to_add)
)
#> Checking input parameters...
#> -- checking start date 01012020
#> -- checking end date 10102021
#> -- checking end date later than start date
#> -- checking metadata
#> -- checking experiment data list
#> --- checking experiment data list slot 1
#> --- checking experiment data list slot 2
#> Input checks completed
#> Chronogram assembling...
#> -- chrongram_skeleton built
#> -- chrongram built with metadata
#> -- adding experiment data
#> --- adding experiment data slot 1 cols... elig_study_id calendar_date serum_Ab_S ...
#> --- adding experiment data slot 2 cols... elig_study_id calendar_date symptom_fever ...
First annotate the vaccines
cg <- cg_annotate_vaccines_count(
  cg,
  ## the prefix to the dose columns: ##
  dose = dose,
  ## the output column name: ##
  dose_counter = dose_number,
  ## the prefix to the date columns: ##
  vaccine_date_stem = date_dose,
  ## use 14d to 'star' after a dose ##
  intermediate_days = 14
)
#> Using stem: date_dose
#> Found vaccine dates
#> date_dose_1
#>
#> date_dose_2

## plot over time ##
cg %>%
  ## refactor for gradient fill ##
  mutate(dose_number = factor(dose_number,
    levels = c(
      "0",
      "1star",
      "1",
      "2star",
      "2"  ))) %>%
  ggplot(
    aes(
      x = calendar_date,
      y = elig_study_id,
      fill = dose_number
    )
  ) +
  geom_tile(height = 0.5) +
  scale_fill_grey(end = 0.2, start = 0.8) +
  theme_bw()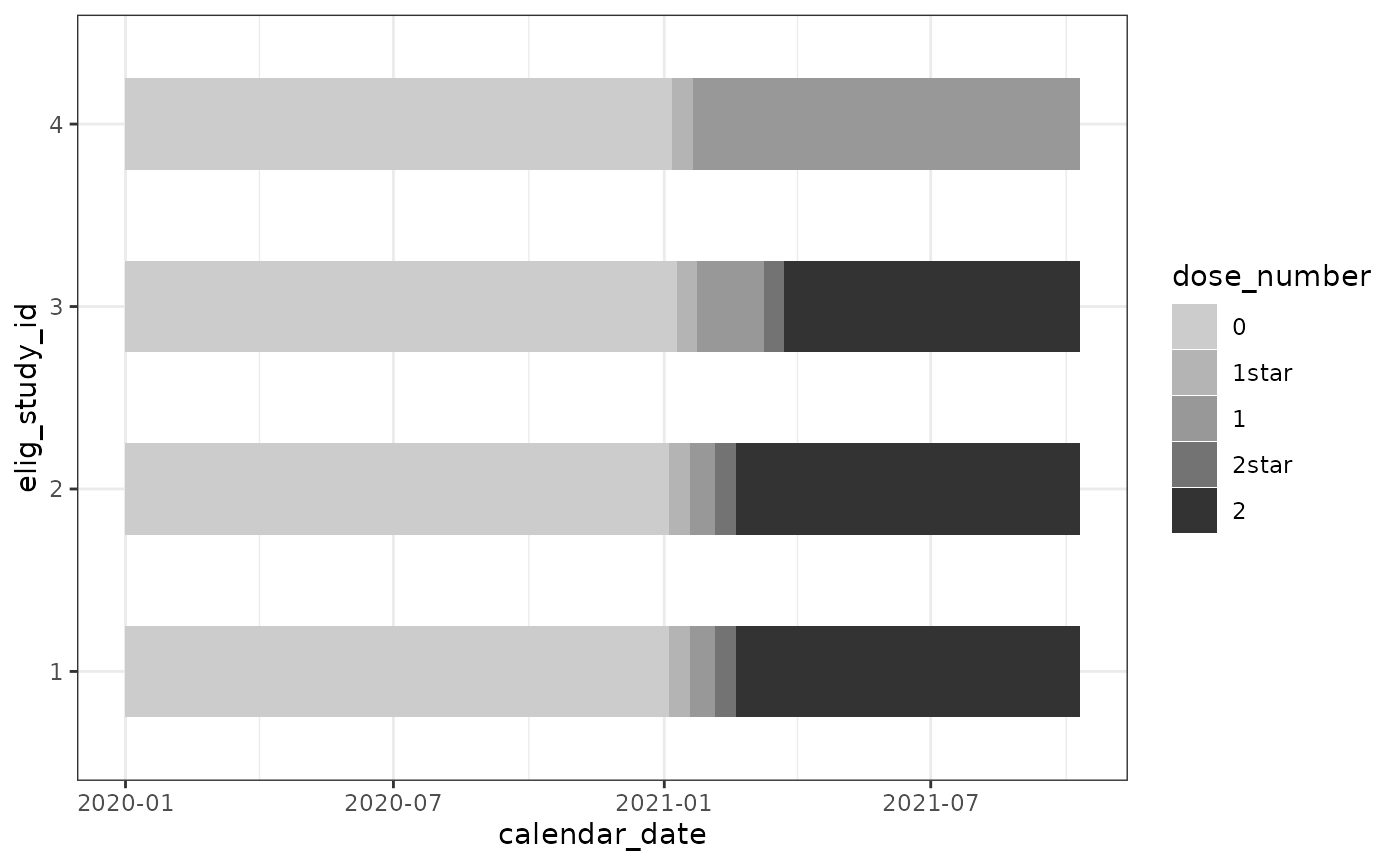
Now we can plot how these symptoms to see how they map in time to vaccinations.
cg %>%
  ## refactor for gradient fill ##
  mutate(dose_number = factor(dose_number,
    levels = c(
      "0",
      "1star",
      "1",
      "2star",
      "2" ))) %>%
  ggplot(
    aes(
      x = calendar_date,
      y = elig_study_id,
      fill = dose_number
    )
  ) +
  geom_tile(height = 0.3) +
  scale_fill_grey(end = 0.2, start = 0.8) +
   geom_point(data = . %>%
               ## filter to symptoms that are present ##
               filter(!is.na(symptom_rash)) %>%
               mutate(symptom_rash = paste("rash", symptom_rash)),
             aes(col = symptom_rash),
             shape = "I",
             size = 4,
             position = position_nudge(y=0.2)) +
   geom_point(data = . %>%

               filter(!is.na(symptom_headache)) %>%

               mutate(symptom_headache = paste("headache", symptom_headache)),
             aes(col = symptom_headache),
             shape = "I",
             size = 4,
             position = position_nudge(y=0.2)) +
  geom_point(data = . %>%

               filter(!is.na(symptom_fever)) %>%

               mutate(symptom_fever = paste("fever", symptom_fever)),
             aes(col = symptom_fever),
             shape = "I",
             size = 4,
             position = position_nudge(y=0.3)) +
   geom_point(data = . %>%

               filter(!is.na(symptom_joint_pain)) %>%

               mutate(symptom_joint_pain = paste("joint pain", symptom_joint_pain)),
             aes(col = symptom_joint_pain),
             shape = "I",
             size = 4,
             position = position_nudge(y=0.4)) +
  ## swap the fill scale, and stop colour being included in this guide ##
  scale_fill_grey(
    end = 0.2, start = 0.8,
    name = "dose_number",
                  na.translate = FALSE,
                  na.value = NA,

                  guide = guide_legend(override.aes = list(color = NA))) +
  ## swap the colour scale ##
  scale_color_brewer(type = "qual",palette = 2,
                     name = "symptoms") +
  theme_bw() +
  theme(legend.position = "right",
        legend.direction = "vertical")
#> Scale for fill is already present.
#> Adding another scale for fill, which will replace the existing scale.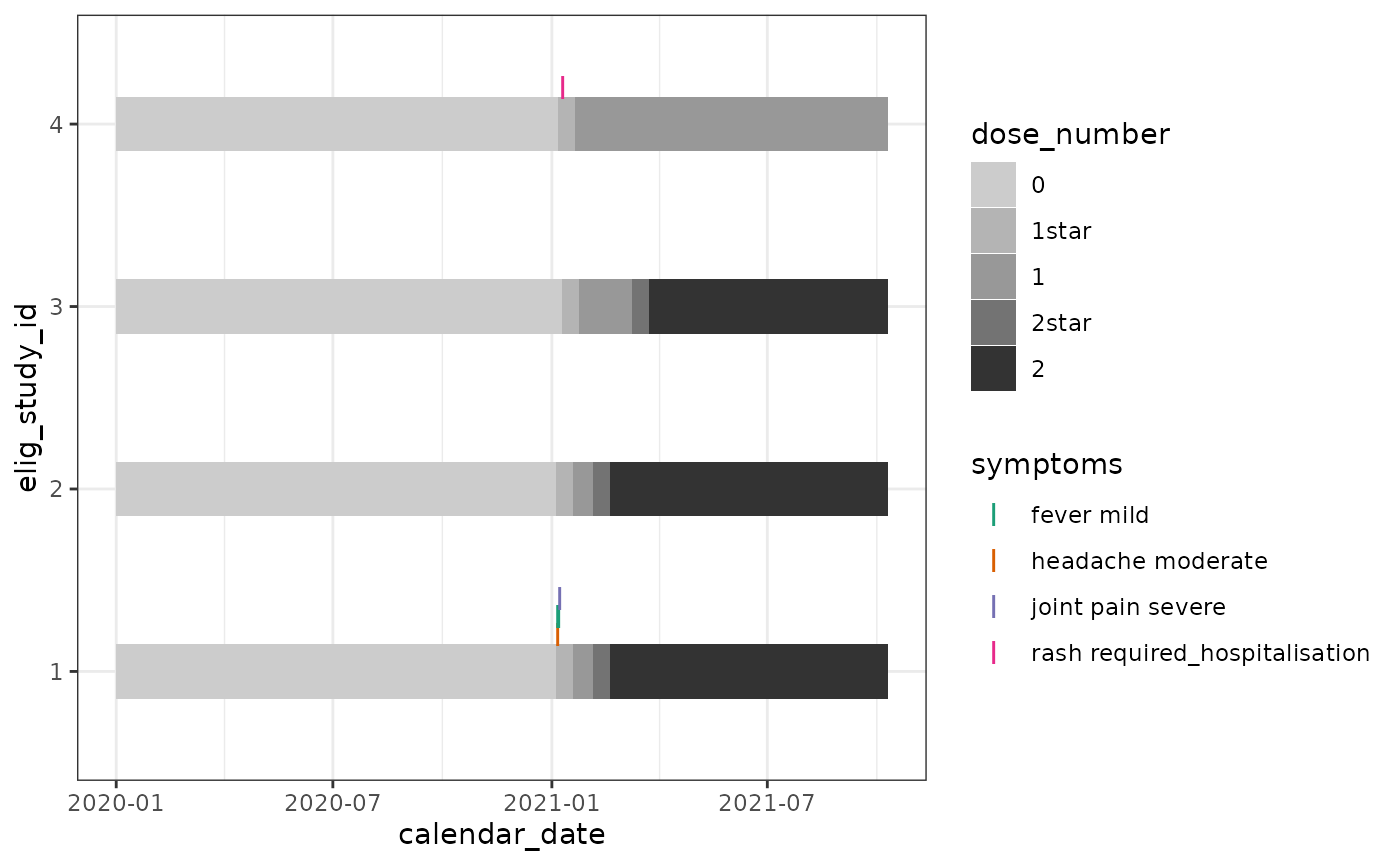
In our test dataset:
participant 1 reported a post-first-dose fever, headache, and joint pain a few days later.
participants 2 and 3 reported no symptoms after either dose.
participant 4 reported a significant symptom after dose 1 and did not receive further doses.
SessionInfo
sessionInfo()
#> R version 4.4.2 (2024-10-31)
#> Platform: x86_64-pc-linux-gnu
#> Running under: Ubuntu 22.04.5 LTS
#>
#> Matrix products: default
#> BLAS:   /usr/lib/x86_64-linux-gnu/openblas-pthread/libblas.so.3
#> LAPACK: /usr/lib/x86_64-linux-gnu/openblas-pthread/libopenblasp-r0.3.20.so;  LAPACK version 3.10.0
#>
#> locale:
#>  [1] LC_CTYPE=C.UTF-8       LC_NUMERIC=C           LC_TIME=C.UTF-8
#>  [4] LC_COLLATE=C.UTF-8     LC_MONETARY=C.UTF-8    LC_MESSAGES=C.UTF-8
#>  [7] LC_PAPER=C.UTF-8       LC_NAME=C              LC_ADDRESS=C
#> [10] LC_TELEPHONE=C         LC_MEASUREMENT=C.UTF-8 LC_IDENTIFICATION=C
#>
#> time zone: UTC
#> tzcode source: system (glibc)
#>
#> attached base packages:
#> [1] stats     graphics  grDevices utils     datasets  methods   base
#>
#> other attached packages:
#> [1] ggplot2_3.5.1    dplyr_1.1.4      chronogram_1.0.0
#>
#> loaded via a namespace (and not attached):
#>  [1] gtable_0.3.6       jsonlite_1.8.9     highr_0.11         compiler_4.4.2
#>  [5] tidyselect_1.2.1   stringr_1.5.1      tidyr_1.3.1        jquerylib_0.1.4
#>  [9] systemfonts_1.1.0  scales_1.3.0       textshaping_0.4.0  yaml_2.3.10
#> [13] fastmap_1.2.0      R6_2.5.1           generics_0.1.3     knitr_1.48
#> [17] tibble_3.2.1       desc_1.4.3         munsell_0.5.1      lubridate_1.9.3
#> [21] RColorBrewer_1.1-3 bslib_0.8.0        pillar_1.9.0       rlang_1.1.4
#> [25] utf8_1.2.4         stringi_1.8.4      cachem_1.1.0       xfun_0.49
#> [29] fs_1.6.5           sass_0.4.9         timechange_0.3.0   cli_3.6.3
#> [33] pkgdown_2.1.1      withr_3.0.2        magrittr_2.0.3     digest_0.6.37
#> [37] grid_4.4.2         lifecycle_1.0.4    vctrs_0.6.5        evaluate_1.0.1
#> [41] glue_1.8.0         farver_2.1.2       ragg_1.3.3         fansi_1.0.6
#> [45] colorspace_2.1-1   purrr_1.0.2        rmarkdown_2.29     tools_4.4.2
#> [49] pkgconfig_2.0.3    htmltools_0.5.8.1